

Tempe, Arizona ranked in the lowest for water quality
Tempe received failing grades for all forever chemicals tested, with the highest PFOS levels reaching 14X (yes, 14X) above the EPA limits. The city also earned a C grade for lead.
To help students understand what's in their water and take control of one of the most overlooked parts of campus life, Culligan analyzed lead and forever chemical levels in the drinking water of 50 college towns across the U.S.
The results were shocking.
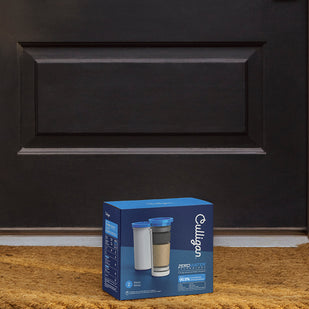
Culligan with ZeroWater Technology is certified to filter 5X more contaminants than a Standard Brita filer, including lead and Total PFAS.
A must have dorm-essential
Shop nowOther fast facts you should know.


The complete U.S. College Towns Water Quality Ranking
| Ranking | College town | Home of | Lead grade | PFOS grade | PFOA grade | Hazard Mixture grade* |
|
50 |
Columbia, SC | University of South Carolina | D | F | F | C |
|
49 |
Tempe, AZ | Arizona State University Campus Immersion | C | F | F | F |
|
47 |
Newark, DE | University of Delaware | C | F | F | C |
|
47 |
New York City, NY | New York University | F | A | A | A |
|
46 |
New Brunswick, NJ | Rutgers University | C | F | F | A |
|
45 |
Brookings, SD | South Dakota State University | D | A | A | A |
|
44 |
University Park, PA | Penn State University | D | A | A | A |
|
43 |
South Kingston, RI | University of Rhode Island | C | A | F | C |
|
42 |
Boston, MA | Boston University | D | A | A | A |
|
41 |
Columbus, OH | Ohio State University | C | A | F | C |
|
40 |
Anchorage, AK | University of Alaska Anchorage | A+ | A | F | F |
|
38 |
Oxford, MS | University of Mississippi | A+ | A | F | C |
|
38 |
Raleigh, NC | NC State University | A+ | F | A | C |
|
37 |
Los Angeles, CA | UCLA | C | A | A | A |
|
36 |
Storrs, CT | UCONN | B | F | A | A |
|
35 |
Lawrence, KS | University of Kansas | C | A | A | C |
|
34 |
Athens, GA | University of Georgia | C | A | A | A |
|
33 |
Lincoln, NE | University of Nebraska | C | A | A | A |
|
32 |
Orono, ME | University of Maine | C | A | A | A |
|
31 |
Columbia, MO | University of Missouri | C | A | A | A |
|
29 |
Madison, WI | University of Wisconsin | C | A | A | C |
|
29 |
Seattle, WA | University of Washington | C | A | A | A |
|
28 |
Las Vegas, NV | University of Nevada | C | A | A | A |
|
27 |
Fargo, ND | North Dakota State University | C | A | A | A |
|
26 |
Orem, UT | Utah Valley University | C | A | A | A |
|
22 |
Ann Arbor, MI | University of Michigan | C | A | A | A |
|
22 |
Champaign, IL | University of Illinois Urbana | C | A | A | A |
|
22 |
Minneapolis/ St. Paul, MN | University of Minnesota | C | A | A | A |
|
22 |
Knoxville, TN | University of Tennessee | C | A | A | C |
|
21 |
College Park, MD | University of Maryland | C | A | A | A |
|
20 |
Boulder, CO | University of Colorado Boulder | C | A | A | A |
|
18 |
Bozeman, MT | Montana State University | C | A | A | A |
|
18 |
Orlando, FL | University of Central Florida | C | A | A | A |
|
17 |
Norman, OK | University of Oklahoma | B | A | A | C |
|
15 |
Burlington, VT | University of Vermont | C | A | A | A |
|
15 |
Corvallis, OR | Oregon State University | C | A | A | A |
|
14 |
Laramie, WY | University of Wyoming | C | A | A | A |
|
13 |
Ames, IA | Iowa State University | C | A | A | A |
|
12 |
College Station, TX | Texas A & M University | C | A | A | A |
|
8 |
Manoa Valley, HI | University of Hawaii | A+ | A | A | C |
|
8 |
Baton Rouge, LA | Louisiana State University and Agricultural & Mechanical College | C | A | A | A |
|
8 |
West Lafayette, IN | Purdue University | C | A | A | A |
|
8 |
Lexington, KY | University of Kentucky | A+ | A | A | C |
|
6 |
Fayetteville, AR | University of Arkansas | B | A | A | A |
|
6 |
Tuscaloosa, AL | University of Alabama | B | A | A | A |
|
5 |
Morgantown, WV | West Virginia University | B | A | A | A |
|
1 |
Albuquerque, NM | University of New Mexico | A+ | A | A | A |
|
1 |
Blacksburg, VA | Virginia Polytechnic Institute and State University | A+ | A | A | A |
|
1 |
Boise, ID | Boise State University | A+ | A | A | A |
|
1 |
Durham, NH | University of New Hampshire | A+ | A | A | A |
Methodology
Culligan ZeroWater analyzed publicly available water quality data(1) for 50 college towns in the United States. The 50 college towns were identified based on the largest university in each state by graduate and undergraduate hybrid enrollment, according to 2024 data from IPEDS(2). Water was specifically evaluated for lead and 5 of the 7 forever chemicals that make up the Total PFAS family.
Scoring System:
Using publicly available data, each of the 50 identified college towns received an A–F grade for lead and for 5 members of the Total PFAS chemical family, based on the federal regulatory limits (MCLs), regulatory goals (MCLGs), and public health toxicology thresholds, where available. Lead and Total PFAS were then weighted equally and combined into a single overall score to provide a simple snapshot of local water quality and presence of these contaminants. For lead, Culligan used the “90th percentile” action level of 10 parts per billion (ppb) set in the USEPA final Lead and Copper Rule Improvements (LCRI) regulation, reduced from 15 ppb in previous years. If exceeded, the action level triggers water systems to implement corrosion control measures and to notify the public. It is not a standard for establishing a safe level of lead.
Contaminant Selection
The analysis focused on lead and five forever chemicals within the Total PFAS family (PFOS, PFOA, PFHxS PFNA and HFPO-DA (GenX)). Lead remains a critical concern as it enters drinking water through aging infrastructure and has been the subject of regulation for decades. Conversely, PFAS, or “forever chemicals,” are considered an emerging contaminant and widely recognized as human-made with growing public concern and legal scrutiny.
1 Lead data was gathered from the public water systems’ (PWS) annual consumer confidence reports (CCR) and considered the federally mandated “90th percentile” calculation. Data for the PFAS chemicals was gathered from the Fifth Unregulated Contaminant Monitoring Rule (UCMR5) with samples taken between 2023-2025 and reported to the US EPA.
2 Hybrid enrollment includes students enrolled in on-campus only sources and partial distance learning (online courses). It excludes numbers for students enrolled in distance learning only.
Learn more about these harmful contaminants.

Total PFAS
"forever chemicals"
-
Where it comes from
PFAS are man-made chemicals found in products like non-stick cookware and firefighting foam. Known as “forever chemicals,” they don’t break down easily and can enter drinking water through industrial sites, landfills, and everyday products.
-
The risk
They can build up in the body over time and have been linked to serious health concerns including certain cancers, hormone and thyroid disruption, weakened immune response, and developmental effects in children.
-
How to protect yourself
Because they can’t be seen, tasted, or smelled in drinking water, many people may be exposed without realizing it. Culligan with ZeroWater Technology is the only pitcher certified to remove 99% of Total PFAS.

Lead
-
Where it comes from
Lead is used in plumbing materials. While modern regulations limit its use, older pipes and fixtures can still introduce lead into drinking water through corrosion.
-
The risk
Lead exposure can pose health risks, particularly for infants, young adults, and pregnant women. Even low levels of lead in drinking water can be a concern over time.
-
How to protect yourself
Because boiling water does not remove lead, many households use water filters that are certified to reduce lead. Culligan with ZeroWater Technology is certified to remove 97% of lead.
Culligan with ZeroWater Technology is certified to reduce 5x more contaminants than Standard Brita.
| Certified to reduce |

|

|

|
|---|---|---|---|
| Total PFAS (forever chemicals) | |||
| Lead | |||
| Nitrates | |||
| Chromium 6 | |||
| Pesticides | |||
| Pharmaceuticals | |||
| Fluoride | |||
| Chlorine |
*Brita is a trademark of Brita LP. As of 3/1/2025 Brita® Performance Data Sheets.
Frequently Asked Questions
Lead: Lead is one of the most well-known and concerning contaminants found in drinking water, and it shows up across college towns nationwide.
Even when water meets federal regulation limits, it may still contain lead. The EPA has stated that no level of lead is considered fully safe and can lead to negative health issues including damage to brain development, the central nervous system, and more. Furthermore, because lead can leach from pipes and other sources after water leaves the municipal systems, even water that contains no lead at its municipal source may contain it by the time it reaches your tap – which is especially relevant for college students living in housing with aging infrastructure.
Total PFAS: PFAS – often referred to as “forever chemicals” – are a growing concern in drinking water due to their persistence in the environment and potential health impacts.
More than 176 million Americans get their drinking water from systems that have tested positive for PFAS. Long-term exposure can cause serious health risks, including cancer. If students have exposure to these chemicals over multiple years in their college towns, they can accumulate in the body, increasing the chance of negative health effects.
By 2029, the EPA will legally enforce the first-ever drinking water standards for PFAS, giving public water systems about three years to begin monitoring for these chemicals and implementing solutions to reduce levels.
Culligan identified 50 college towns by selecting the largest university in each state based on combined undergraduate and graduate enrollment, using the most recent (2024) data from the Integrated Postsecondary Education Data System (IPEDS). Enrollment was classified as hybrid, accounting for students with both in-person main campus and partial virtual attendance. Community colleges were excluded from the analysis because they are often a network of campus across the state and are not serviced by a single water system. In the case of schools with multiple campuses, the water system was determined based on the “main campus.”
Quality scores were developed by grading the testing results from each college town’s water system against federal (EPA) standards and additional public health guidance on toxicology thresholds. This allowed each college town to be graded based on regulatory limits and consider associated health risk due to exposure and the toxicity. It’s important to note that in the case of lead, even if levels are under the EPA limit doesn’t mean it’s “safe” – no amount of lead in drinking water is safe.
Lead and Total PFAS were then weighted equally and combined into a single overall score to provide a simple snapshot of local water quality and presence of these contaminants.
Using publicly available data, each of the 50 identified college towns received an A–F grade for lead and for 5 members of the Total PFAS chemical family, based on the federal regulatory limits (MCLs), regulatory goals (MCLGs), and public health toxicology thresholds, where available.
Lead and Total PFAS were then weighted equally and combined into a single overall score to provide a simple snapshot of local water quality and presence of these contaminants. For lead, Culligan used the “90th percentile” action level of 10 parts per billion (ppb) set in the USEPA final Lead and Copper Rule Improvements (LCRI) regulation, reduced from 15 ppb in previous years. If exceeded, the action level triggers water systems to implement corrosion control measures and to notify the public. It is not a standard for establishing a safe level of lead.
The EPA has publicly acknowledged that no amount of lead in drinking water is considered “safe,” which is why have set a goal of 0. We used a combination of the legal limit as well as the goal to evaluate lead levels in college towns.
To conduct this analysis, Culligan ZeroWater assessed towns based on the largest university with in-person enrollment in each state. At this time, there is not a single, comprehensive dataset that compares water quality across all U.S. college towns. Our goal in launching this initial analysis is to help spark broader awareness and conversation about water quality for college students, highlighting the need for more accessible data so people can be empowered to make more informed decisions about what they’re drinking. If your college town was not included in the list, there are still steps you can take to better understand your local water, like checking your local water utility’s Consumer Confidence Report (CCR). This report provides annual water quality data, via the EPA’s CCR search tool or by calling your local water supplier.